
Projects rarely fail because people don’t work hard enough. More often, they stumble because the team can’t see clearly what’s happening. Updates are scattered across channels, tasks vanish into long lists, and the only way to gauge progress is to ask everyone individually — wasting time and energy.
The frustrating thing is, Jira configuration already has all the answers. It knows what’s done, what’s pending, and what’s stuck. But unless you have a clear way of viewing it, all that valuable information remains locked away in the background. That’s where the ability to track progress with dashboards becomes a game-changer.
Dashboards bring everything together in one place — a visual control panel for your project. They strip away the noise, leaving only the details that matter. Reports then step in to dig deeper, giving you the “why” behind the numbers. Together, they turn Jira from a task tracker into a decision-making engine.
This guide will show you how to design dashboards and reports that not only look good but also help you run projects more effectively — and make it second nature to track progress with dashboards every day.
Why Dashboards and Reports Deserve More Attention
It’s easy to underestimate the power of a well-built dashboard. Open one in the morning, and within seconds you know who’s busy, what’s falling behind, and where potential roadblocks are forming. You’re not chasing updates or piecing together information from different places — it’s all there in one snapshot.
Reports, on the other hand, are your in-depth investigation tools. Where dashboards give you the big picture, reports let you zoom in and see what’s really going on. Want to know why a sprint ended with so many unfinished tasks? Or which stage in your workflow consistently causes delays? That’s where reports shine.
When you combine them, you’re not just looking at data — you’re gaining insight you can act on. That’s the real benefit of learning to track progress with dashboards.
Dashboards vs Reports: Two Tools, One Goal
While they work together, dashboards and reports play different roles.
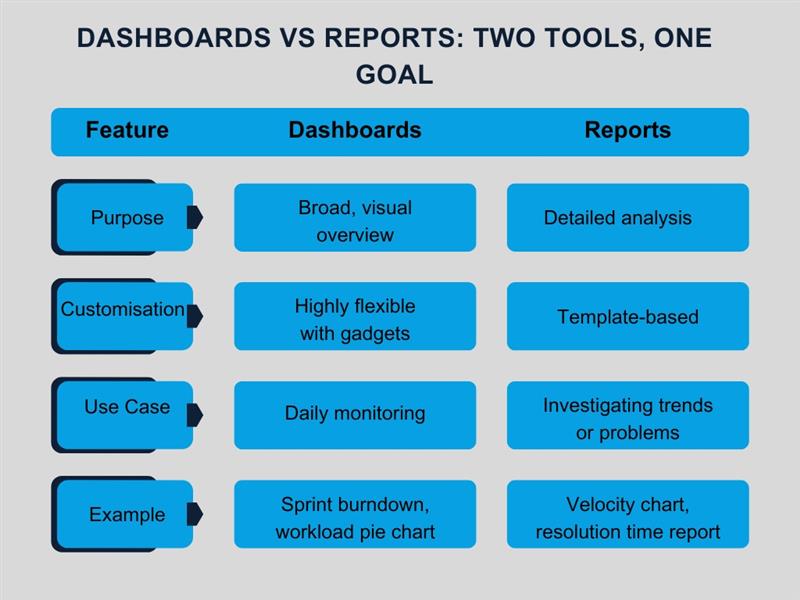
If your dashboard is the daily news bulletin, reports are the deep-dive documentaries. One keeps you informed in real time; the other helps you understand the bigger patterns. Both are essential if you want to track progress with dashboards in a meaningful way.
Step 1: Start with a Clear Purpose
A dashboard is only useful if it’s focused. One of the most common mistakes is adding every chart and gadget available, “just in case.” That approach creates clutter and confusion.
Instead, start by deciding what you actually need to see.
- Agile teams often centre dashboards around sprint health: burndown charts, blockers, and velocity.
- Service teams may focus on SLA compliance, ticket resolution times, and backlog size.
- Executives tend to want a high-level view: tasks completed vs planned, overdue work, and major risks.
By defining the purpose first, you ensure your dashboard makes it easy to track progress with dashboards without distracting extras.
If you’re unsure how your project structure affects dashboard design, our Jira project types article is a good starting point.
Step 2: Choose Gadgets That Matter
Jira gadgets are the building blocks of any dashboard. But more isn’t always better — you need the right mix.
Some popular, practical choices:
- Filter Results – Displays a live list of tasks matching a saved filter.
- Two-Dimensional Filter Statistics – Cross-references two fields, such as status vs assignee.
- Created vs Resolved Chart – Shows whether the team is keeping pace with incoming work.
- Sprint Burndown – Tracks remaining work against time.
- Pie Chart – Breaks down issues by type, priority, or other criteria.
- Average Age Chart – Highlights old tasks still in progress.
- Workload Pie Chart – Makes it clear who’s overloaded and who has capacity.
The test is simple: if a gadget doesn’t help you make a decision or take action, leave it out. Every element should serve your goal to track progress with dashboards effectively.
Step 3: Keep Your Dashboard Tidy
Dashboards are like physical workspaces — a tidy one helps you think clearly, a messy one slows you down.
- Limit the number of gadgets so important ones don’t get buried.
- Group related metrics together so scanning them feels intuitive.
- Use clear, plain names for each gadget.
- Put the most important visuals at the top of the page.
When your layout is clean, you can track progress with dashboards quickly, without having to hunt for the right chart.
Step 4: Let Reports Fill in the Detail
Dashboards are for scanning; reports are for studying. The moment you spot something unusual on a dashboard, you should be able to jump to a report for more detail.
Useful Jira reports include:
- Sprint Report – Highlights what was completed, what wasn’t, and why.
- Velocity Chart – Helps predict future sprint capacity.
- Cumulative Flow Diagram – Shows where work is piling up.
- Resolution Time Report – Reveals how long tasks take to complete.
- Workload Report – Ensures fair distribution of tasks.
When these reports are only a click away, it’s much easier to track progress with dashboards and then act on what you find.
Step 5: Make Dashboards a Shared Resource
A dashboard no one sees isn’t much use. If you want it to drive change, it needs to be visible to everyone who can act on the information.
That could mean:
- Creating a shared team dashboard for daily check-ins.
- Giving managers their own higher-level view.
- Making key dashboards visible on screens in the office.
Try this: Build one shared dashboard for your team this week and review it together in your next meeting. You’ll quickly see how much easier it is to track progress with dashboards when everyone’s looking at the same information.
Step 6: Design for Action, Not Decoration
The best dashboards don’t just display numbers — they prompt action. You can achieve that by:
- Highlighting overdue tasks in red.
- Putting blockers at the top so they can be fixed quickly.
- Showing trend lines that indicate workload shifts.
- Reviewing the dashboard as part of your regular stand-ups.
That way, when you track progress with dashboards, you’re not just observing — you’re improving.
Step 7: Build Dashboards for Different Audiences
Not everyone in your organisation needs the same view of the project. A developer might want to see their own sprint progress and blockers, whereas a senior stakeholder might only care about milestone completion and risk.
Creating audience-specific dashboards ensures everyone gets the information they need without being overloaded. For example:
- Team Dashboards – Focus on daily progress, task allocation, and blockers.
- Management Dashboards – Highlight high-level KPIs, budget status, and delivery timelines.
- Client Dashboards – Present only agreed deliverables, deadlines, and visible progress.
When you track progress with dashboards that are tailored to the right people, you avoid confusion and ensure every viewer gets value from the data.
Step 8: Use Automation to Keep Data Fresh
A dashboard is only as good as the data feeding it. If team members forget to update issues or if reports rely on manual inputs, accuracy suffers. That’s where Jira’s automation features can help.
You can:
- Automatically change issue statuses when certain actions are taken.
- Assign tasks based on workload to balance the team.
- Trigger reminders for unresolved issues after a set number of days.
- Update fields so your gadgets always reflect real-time progress.
Automated workflows mean that when you track progress with dashboards, you’re seeing the truth — not yesterday’s estimates.
Step 9: Bring in Data from Beyond Jira
Jira might be your primary project hub, but it’s not the only place where useful information lives. If you use tools like Confluence, Slack, or Trello, you can often integrate them to enrich your dashboards.
- Link to relevant Confluence pages directly from dashboard gadgets.
- Use marketplace apps to pull in data from other tools.
- Display customer satisfaction scores alongside SLA data for a fuller view.
This wider approach means you’re not just learning to track progress with dashboards — you’re building a complete operational picture.
Step 10: Review and Refine Regularly
A dashboard that was perfect six months ago might be out of date today. As your team, processes, and goals change, your dashboards should change with them.
Review them monthly and ask:
- Does this still help us make decisions?
- Is there a gadget no one uses?
- Do we need to add or remove any metrics?
Keeping dashboards relevant ensures that when you track progress with dashboards, the insights are always actionable.
Common Pitfalls and How to Avoid Them
Even experienced teams can fall into dashboard traps. Here are a few to watch out for:
- Too much data – Overloading your dashboard makes it harder to spot what’s important.
- Out-of-date filters – If your saved filters don’t match your current workflow, your dashboard will mislead you.
- Private dashboards – If only one person sees it, it’s not helping the team.
- Vanity metrics – Numbers that look good but don’t drive action waste space.
Avoid these and you’ll get much more from your ability to track progress with dashboards.
Scenario: Turning Dashboard Insight into Action
Imagine your sprint dashboard shows the burndown line flatlining halfway through the week. Tasks aren’t being closed, even though time is ticking away.
You dig deeper and see that half the issues are stuck waiting for review. A quick conversation reveals that the reviewer is swamped with unrelated urgent work.
Armed with this insight, you can:
- Reassign review tasks temporarily.
- Adjust workload distribution in the next sprint.
- Add a gadget to track review queue size for early warnings.
This is exactly why we track progress with dashboards — so problems are spotted early enough to fix, rather than explained after the fact.
Industry-Specific Dashboard Examples
Different industries have different priorities. Here’s how you might tailor dashboards:
Software Development
- Sprint burndown chart
- Blockers list
- Code review queue
- Velocity chart
Customer Support
- SLA compliance
- Open vs resolved tickets
- Average response time
- Customer satisfaction scores
Marketing Teams
- Campaign task tracker
- Content approval queue
- Lead conversion metrics
- Deadline tracker
By aligning your setup with industry needs, you make it easier to track progress with dashboards in ways that directly support your business goals.
Making Dashboards Part of the Culture
The most effective dashboards aren’t hidden in Jira, only checked when something goes wrong. They’re part of the team’s daily rhythm.
Some ways to integrate them:
- Review dashboards in daily stand-ups.
- Display them on screens in the office.
- Include screenshots in weekly progress emails.
When everyone sees the same data regularly, accountability improves and it becomes second nature to track progress with dashboards.
How CodeDesk Can Support Your Jira Setup
Getting your dashboards right starts with setting up Jira in a way that works for your team — and that’s not always straightforward. That’s where CodeDesk comes in. Whether you’re new to Jira or want to fine-tune an existing setup, our team can help you configure your projects, issue types, and workflows so your dashboards show meaningful, accurate data from day one. If you’d like expert guidance on customising Jira to match your team’s needs, explore how we handle Jira configuration.
Final Thought
A dashboard is more than a collection of charts and gadgets. Done right, it’s a live, evolving tool that helps your team focus, collaborate, and adapt. When paired with well-chosen reports, it gives you both the quick view and the deep dive — the headline and the backstory.
The key is to be intentional. Define your purpose, choose gadgets that matter, keep the design clean, and make it a shared, living resource. Review it often, and don’t be afraid to refine it as your work evolves.
Above all, remember why you’re doing it: the real power of Jira comes when you track progress with dashboards and let the insight guide what you do next.
For more details, visit: https://code-desk.com/services/services-jira-configuration/ and explore how expert Jira configuration can streamline your workflow.